Michael Burry's AI Short, by the Numbers: 5 Names and a Semiconductor Index 65% Above Its 200-Day Average
Michael Burry's AI Short, by the Numbers: 5 Names and a Semiconductor Index 65% Above Its 200-Day Average
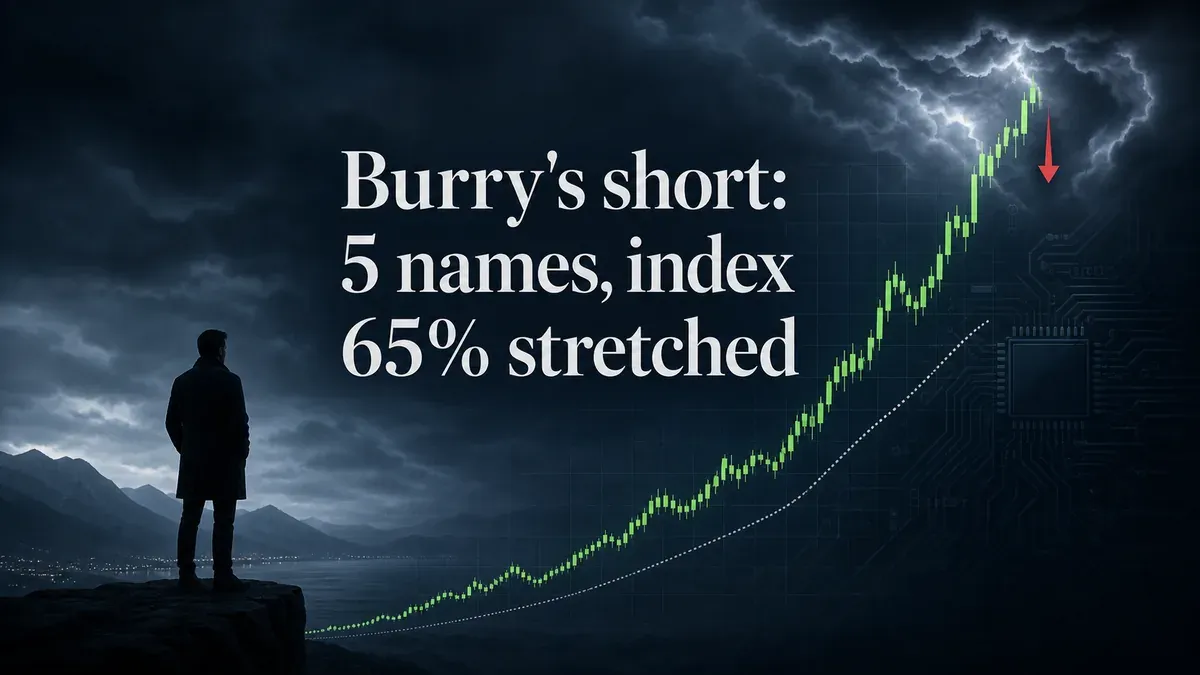
In early July 2026, "Big Short" investor Michael Burry disclosed a cluster of bearish bets across the AI hardware trade — Nvidia, Caterpillar, Applied Materials, Tesla, and the iShares Semiconductor ETF — arguing the chip boom is "the beginning of the end." The most quoted number: the Philadelphia Semiconductor Index was trading more than 65% above its 200-day moving average, a stretch seen only once before, in 2000. Here is exactly what he disclosed, what the numbers do and don't prove, and how to read a Burry short without overreacting.
Michael Burry does one thing better than almost anyone: he makes a bearish case loud enough that the whole market stops to listen. In early July 2026 he did it again, laying out short positions and put options against the companies powering the AI build-out — and framing the semiconductor rally as historically stretched. The headlines wrote themselves. But a Burry disclosure is easy to misread, because the way these bets are structured matters as much as the names in them. Let's separate the signal from the noise.
Table of Contents
- What Burry Actually Disclosed
- The One Number Everyone Quoted: 65% Above the 200-Day
- Puts vs. Shorts: Why the Disclosure Overstates the Bet
- How to Read a Burry Short Without Overreacting
What Burry Actually Disclosed
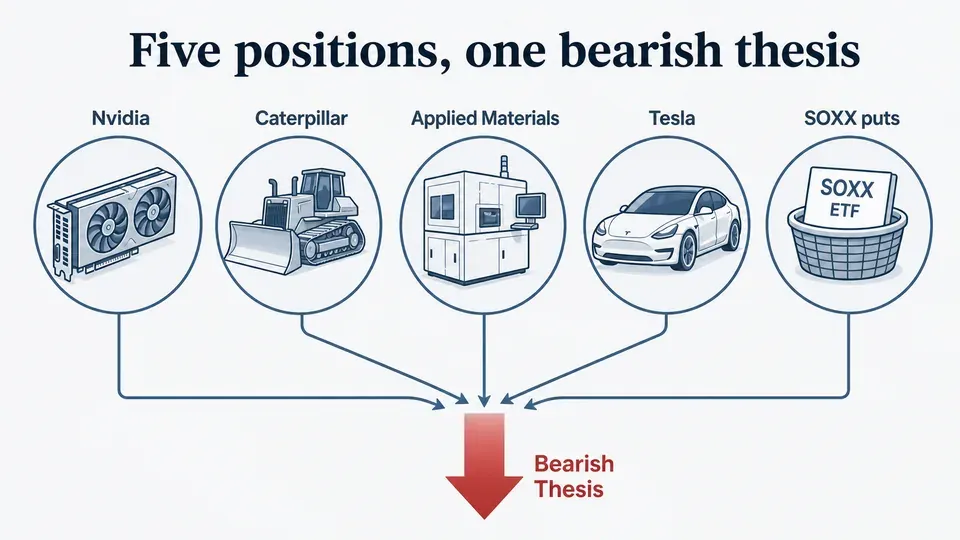
Burry, who runs Scion Asset Management, revealed the positions through public posts in early July 2026. Rather than a single trade, it was a basket spanning the AI supply chain — the chipmakers, the equipment that makes the chips, and the industrial names riding the data-center build-out. The disclosed entry prices give an unusually concrete picture:
| Name | Ticker | Role in the AI trade | Disclosed entry |
|---|---|---|---|
| Nvidia | NVDA | The core AI GPU maker | ~$198.09 |
| Caterpillar | CAT | Machinery and power for data-center build-out | ~$1,060.98 |
| Applied Materials | AMAT | Sells the equipment that makes advanced chips | ~$729.40 |
| Tesla | TSLA | AI/robotics-narrative megacap | ~$416.22 |
| iShares Semiconductor ETF | SOXX | Wraps the whole chip group into one ticker (put options) | strikes raised to $400+ |
The logic of the basket is that it isn't really five separate bets — it's one bet, expressed five ways. Applied Materials only sells well if chipmakers are expanding; Caterpillar's data-center tailwind depends on the capex cycle continuing; the SOXX puts are a blunt instrument against the entire group at once. Some outlets also reported a short against Micron, underscoring that the thesis is aimed at the AI-hardware complex broadly, not one company.
## The One Number Everyone Quoted: 65% Above the 200-Day
The statistic that traveled fastest was about the Philadelphia Semiconductor Index (SOX): Burry pointed out it was trading more than 65% above its 200-day moving average — a level of extension seen only once before, in the year 2000, right before the dot-com unwind. He paired that with a valuation note that the index's price-to-sales ratio had pushed past 16x even when you strip Nvidia out of the math.
Why does the 200-day moving average matter? It's a rough proxy for the trend's center of gravity. Prices routinely run 10–20% above it in a healthy bull market. Running 65% above it is a different animal — it means the recent move has far outrun its own one-year baseline. That doesn't guarantee a crash; extreme readings can persist and even extend. But it does mean the group has priced in a great deal of good news, leaving little cushion if the AI capex narrative wobbles. Burry's trigger, in his words, was a fresh wave of Korean semiconductor spending fueling the rally — which he called "the beginning of the end."
For readers who want the fuller bull-vs-bear framing behind this, our earlier breakdown of whether AI is a bubble, using the actual capex data, lays out both sides of the same argument Burry is now trading on.
Puts vs. Shorts: Why the Disclosure Overstates the Bet
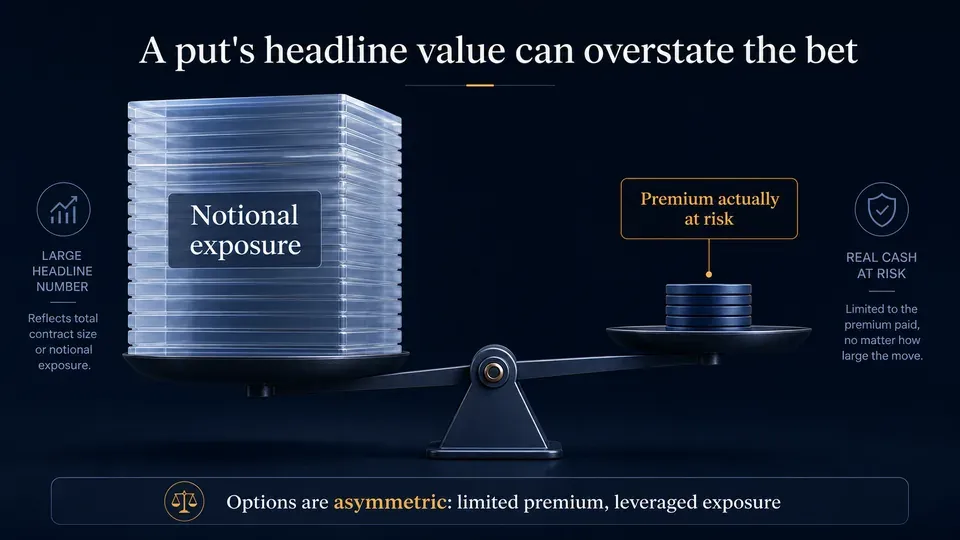
Here is the part most headlines skip, and it's the single most important thing to understand. Burry's bearish bets are a mix of direct short positions and put options — and when the bet is expressed through puts, the disclosed size can wildly overstate the actual capital at risk.
The reason is how options are reported. A put position is often listed at the notional value of the underlying shares it controls, not the premium actually paid. A trader can control a $100 million notional short with a few million dollars of premium — and that premium is the real maximum loss. So a disclosure that looks like a nine-figure "bet against Nvidia" can, in practice, be a far smaller wager with a defined, limited downside.
| What the disclosure shows | What it often actually means |
|---|---|
| Large notional put position | Much smaller premium at risk |
| "Shorting" a megacap | A defined-loss options bet, not unlimited short exposure |
| A five-name basket | One macro thesis, cheaply expressed |
| Aggressive-looking size | Position can be exited within weeks |
This isn't hypothetical. Burry has flagged bubbles before — famously housing in the mid-2000s, but also Big Tech and Nvidia via options in 2023, several of which he exited within a quarter or two. The lesson isn't that he's wrong; it's that a Burry disclosure is a snapshot of a view, not a locked-in, must-hold conviction trade. Treat the notional headline number with suspicion, and focus on the thesis instead.
## How to Read a Burry Short Without Overreacting
A Burry disclosure is a prompt to check your own assumptions, not a sell signal. Three practical filters:
- Separate the thesis from the trade. The thesis — that the semiconductor group is historically extended and priced for perfection — is testable and worth weighing regardless of what Burry does next. The specific positions may already have changed by the time you read about them.
- Ask what would have to be true. For the shorts to pay off, AI capex growth has to slow or valuations have to compress. If you believe the build-out keeps accelerating, the 65%-above-average reading is a feature, not a warning.
- Mind the timing risk. "Stretched" can stay stretched for a long time. The 2000 comparison cuts both ways: the index was extreme well before it actually rolled over, and shorts who were early still bled in the interim.
The honest takeaway is that Burry has surfaced a real, measurable statistic about how far the chip rally has run — and wrapped it in bets whose structure makes them look bigger than they are. Both things are true at once.
Frequently Asked Questions (FAQ)
Is Michael Burry shorting Nvidia directly? He disclosed bearish exposure to Nvidia at around $198.09, but his bets across the basket are a mix of direct shorts and put options. With puts, the reported size reflects notional value, not the actual money at risk.
What did Burry mean by "the beginning of the end"? He tied the phrase to a fresh surge in Korean semiconductor spending driving the chip index higher, arguing that this late-stage euphoria is a classic sign a cycle is topping — not that a crash is imminent on any specific date.
Is the "65% above the 200-day moving average" figure reliable? It refers to the Philadelphia Semiconductor Index and was the statistic Burry emphasized. It's a measure of how far the group has run above its one-year trend; comparable extension was last seen in 2000. It signals stretch, not a guaranteed reversal.
Should retail investors copy the trade? Copying a disclosed short is risky: the positions may already be closed, options bets decay with time, and "expensive" markets can keep rising. The more useful move is to stress-test your own AI exposure against Burry's thesis.
Key Takeaways
- Burry disclosed a five-name bearish basket in early July 2026 — Nvidia, Caterpillar, Applied Materials, Tesla, and the SOXX ETF — with some reports adding Micron.
- His headline data point: the Philadelphia Semiconductor Index was more than 65% above its 200-day moving average, a stretch last seen in 2000, with a price-to-sales ratio above 16x excluding Nvidia.
- The bets are a mix of shorts and put options; notional put sizes can overstate the real capital at risk by a wide margin.
- Burry has been early on bubble calls before and has exited fast — read this as a testable thesis, not a locked-in conviction trade.
- The useful response is to pressure-test your own AI-hardware exposure, not to mirror a disclosure that may already be stale.
How this was written: Research and a first draft came together with AI's help; verification and the final pass were entirely human.
References
- Benzinga — Michael Burry Reveals Tesla, Nvidia Shorts, Says Chip Boom Is 'Beginning of the End'
- The Motley Fool — "Big Short" Investor Michael Burry Is Now Betting Against Micron, Nvidia, and Tesla
- Electrek — Big Short's Michael Burry discloses new Tesla (TSLA) position
- TheStreet — Michael Burry's newest short reveals what really worries him about AI

Comments ()