Goldman Quietly Doubled Its 10-Year Stock Forecast From 3% to 6.5% — What Actually Changed
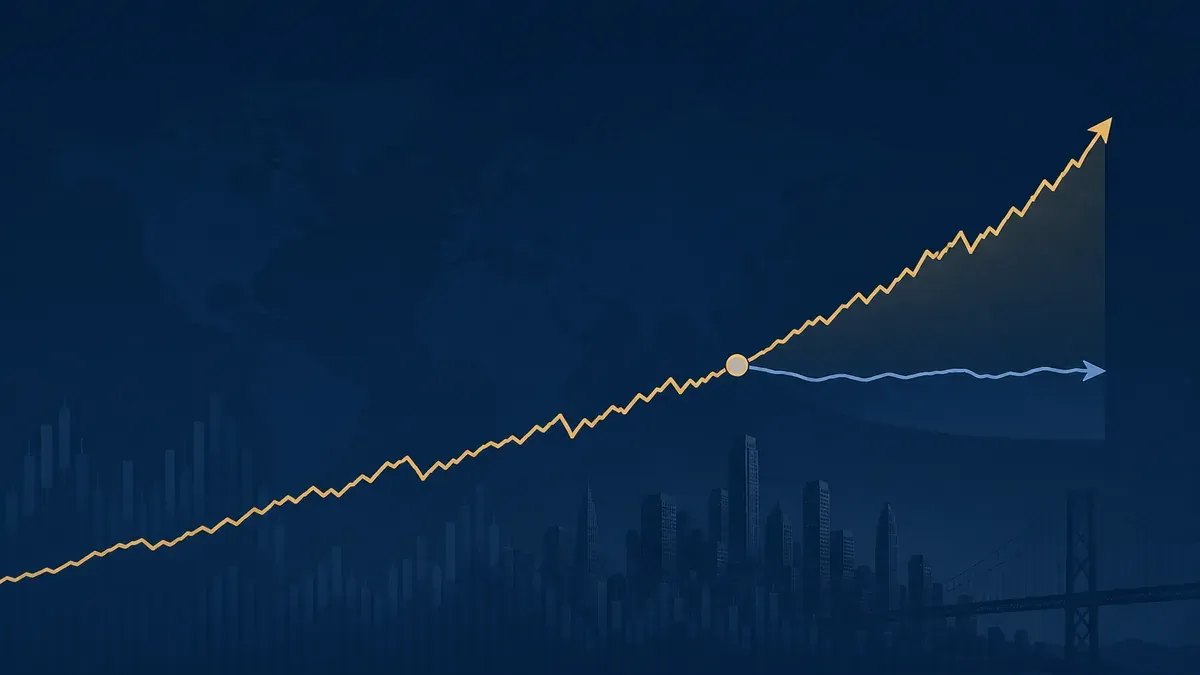
In October 2024, Goldman Sachs warned the S&P 500 would return just 3% a year for a decade — a near "lost decade." By November 2025 they had lifted that to 6.5%. Same bank, same index, more than double the forecast in about a year. This is what changed, why long-run forecasts move so much, and what a 3.5-point swing actually does to your money.
Long-range market forecasts get treated like prophecy, but they're really just arithmetic with assumptions. Goldman's own numbers prove it. The bank's equity strategy team went from a gloomy 3% annualized 10-year call to a much cheerier 6.5% in roughly twelve months — without the world ending or a boom arriving. If you want to understand why "the next decade will be bad for stocks" headlines should never drive your plan, this reversal is the perfect case study.
The two forecasts, side by side
Here's the walk-back in plain numbers:
| Forecast | 10-year annualized S&P 500 total return | Framing |
|---|---|---|
| Oct 2024 (Kostin team) | 3% nominal | ~7th percentile since 1930; "lost decade" risk |
| Nov 2025 (updated model) | 6.5% nominal | Modest but roughly double the earlier call |
The October 2024 version was genuinely bleak. Goldman put the 3% figure in the 7th percentile of all 10-year returns since 1930 — down sharply from the 13% annualized the S&P had delivered over the prior decade. Their model spat out a range from about +7% to −1% a year, and, most strikingly, implied a 72% probability that stocks would trail bonds over the following ten years. That's the number that earned the "lost decade" label.
Thirteen months later, the same framework said 6.5%. So what moved?
Why long-run forecasts swing this hard: it's mostly the starting price
These 10-year models are dominated by one input: starting valuation. The logic is mean reversion — buy stocks when they're expensive relative to earnings and your future returns tend to be lower, because part of your gain gets eaten by the multiple drifting back down. Buy them cheaper and the opposite.
In October 2024, Goldman flagged a CAPE ratio (cyclically adjusted P/E) of about 38 — the 97th percentile historically. When you start that high, the model assumes years of valuation drag, which is exactly how you arrive at a 3% number.
Two things then shifted the math upward by late 2025:
- Earnings caught up. When profits grow into a high price instead of the price falling, the "expensive" starting point gets less punishing. Strong earnings growth (Goldman later penciled in EPS of roughly $340 for 2026, ~24% growth) does a lot of the work.
- The concentration adjustment got reweighed. A huge chunk of the index sits in a handful of mega-caps — the top 10 companies are ~39% of index value and ~31% of earnings, with market breadth near its narrowest since the dotcom era. That concentration cuts both ways in the model, and the updated read was less bearish about it.
The point isn't which number is "right." It's that a forecast built mostly on today's price will always move a lot when prices and earnings move. A 3.5-point revision looks dramatic, but it's the model behaving exactly as designed.
What a 3.5-point swing does to real money
Small-sounding annual differences compound into large gaps. Here's $10,000 left to grow for 10 years at each rate:
| Annual return | $10,000 after 10 years |
|---|---|
| 3% (2024 "lost decade" call) | ~$13,439 |
| 6.5% (2025 revised call) | ~$18,771 |
| 13% (the prior decade's actual) | ~$33,946 |
The gap between Goldman's own two forecasts — 3% vs 6.5% — is about $5,300 on a $10,000 stake over a decade. And the gap between "modest 6.5%" and "the last decade repeats at 13%" is another ~$15,000. This is why obsessing over a single long-range point estimate is a trap: the honest answer spans a wide cone, and even the bank publishing the number moves it by huge margins year to year.
What a "lost decade" actually looks like — and how to plan around it
A real lost decade isn't hypothetical. From 2000 to roughly 2010, the S&P 500 delivered close to zero price return — investors who bought at the dotcom peak waited ten-plus years just to break even. That's the scenario the 3% (or the −1% tail) call was gesturing at.
But here's the practical takeaway: you can't time your way around a forecast this uncertain, so build a plan that survives either outcome.
- Treat 10-year forecasts as a cone, not a point. Goldman's own range was −1% to +7%. Plan for the middle, stress-test the low end.
- Lower expected returns raise the value of the boring stuff — your savings rate, fees, and tax efficiency matter far more when the market is only handing you 3–6% than when it's gifting 13%.
- Valuation-based forecasts are best for setting expectations, worst for timing. They've been "too high" for years at a stretch. Use them to stay humble, not to jump in and out.
- Diversification is the hedge against being wrong about US mega-caps. If the entire bear case rests on a top-heavy index, the answer isn't to guess — it's to not bet everything on the same ten names.
The story here isn't "Goldman was wrong then and right now." It's that even the most resourced forecasters revise by 100%+ in a year, so your financial plan shouldn't hinge on any of them being precise.
Frequently Asked Questions (FAQ)
Did Goldman admit the 3% forecast was a mistake? Not exactly. The updated 6.5% came from feeding current prices and earnings into the same valuation-driven framework. The inputs changed, so the output changed — that's the model working, not a mea culpa.
Why does starting valuation matter so much for 10-year returns? Over long horizons, returns come from earnings growth, dividends, and the change in valuation multiple. Starting expensive means the multiple likely shrinks, subtracting from returns. Starting cheap adds to them.
Is 6.5% good or bad? It's below the long-run historical average of roughly 10–11% and well under the last decade's ~13%. It's "fine, not great" — enough to build wealth over time, but not the effortless run of the 2010s.
Should I sell stocks because of a low long-term forecast? History says forecasts like these are poor timing signals — markets have often kept climbing for years after "expensive" warnings. Use them to set expectations and savings rates, not to exit.
What is CAPE and why 38 mattered? CAPE is price divided by 10-year average inflation-adjusted earnings. A reading of ~38 sat in the 97th percentile historically, signaling stocks were very expensive relative to their earnings power — the core reason the 2024 forecast was so low.
Key Takeaways
- Goldman revised its 10-year S&P 500 forecast from 3% (Oct 2024) to 6.5% (Nov 2025) — more than double, in about a year.
- The 2024 call was extreme: 7th percentile since 1930, with a 72% implied probability stocks trail bonds, driven by a CAPE near 38.
- These forecasts swing hard because they're dominated by starting valuation; when earnings grow into high prices, the outlook improves.
- On $10,000 over 10 years, 3% vs 6.5% is roughly $13,400 vs $18,800 — a ~$5,300 gap from one bank's own revision.
- Don't build a plan on any single long-range forecast. Save more, diversify, and treat forecasts as a range, not a promise.
References
CNBC (Oct 21, 2024): "Goldman forecasts just a 3% S&P 500 annual return the next 10 years, down from 13% the last decade" — https://www.cnbc.com/2024/10/21/goldman-forecasts-just-a-3percent-sp-500-annual-return-the-next-10-years.html - Seeking Alpha (Nov 2025): "Decade ahead: Goldman projects 6.5% annual return for S&P 500" — https://seekingalpha.com/news/4520573-decade-ahead-goldman-projects-6_5-percent-annual-return-for-s-and-p-500 - Goldman Sachs Research: "Building Long-Term Returns: Our 10-Year Forecasts" (Nov 12, 2025) — https://www.gspublishing.com/content/research/en/reports/2025/11/12/0c292cc7-ce42-4fba-a026-744231e9f4f4.html - Goldman Sachs: "US Stocks Are Forecast to Rise 6% in 2026" — https://www.goldmansachs.com/insights/articles/us-stocks-forecast-to-rise-in-2026


Comments ()